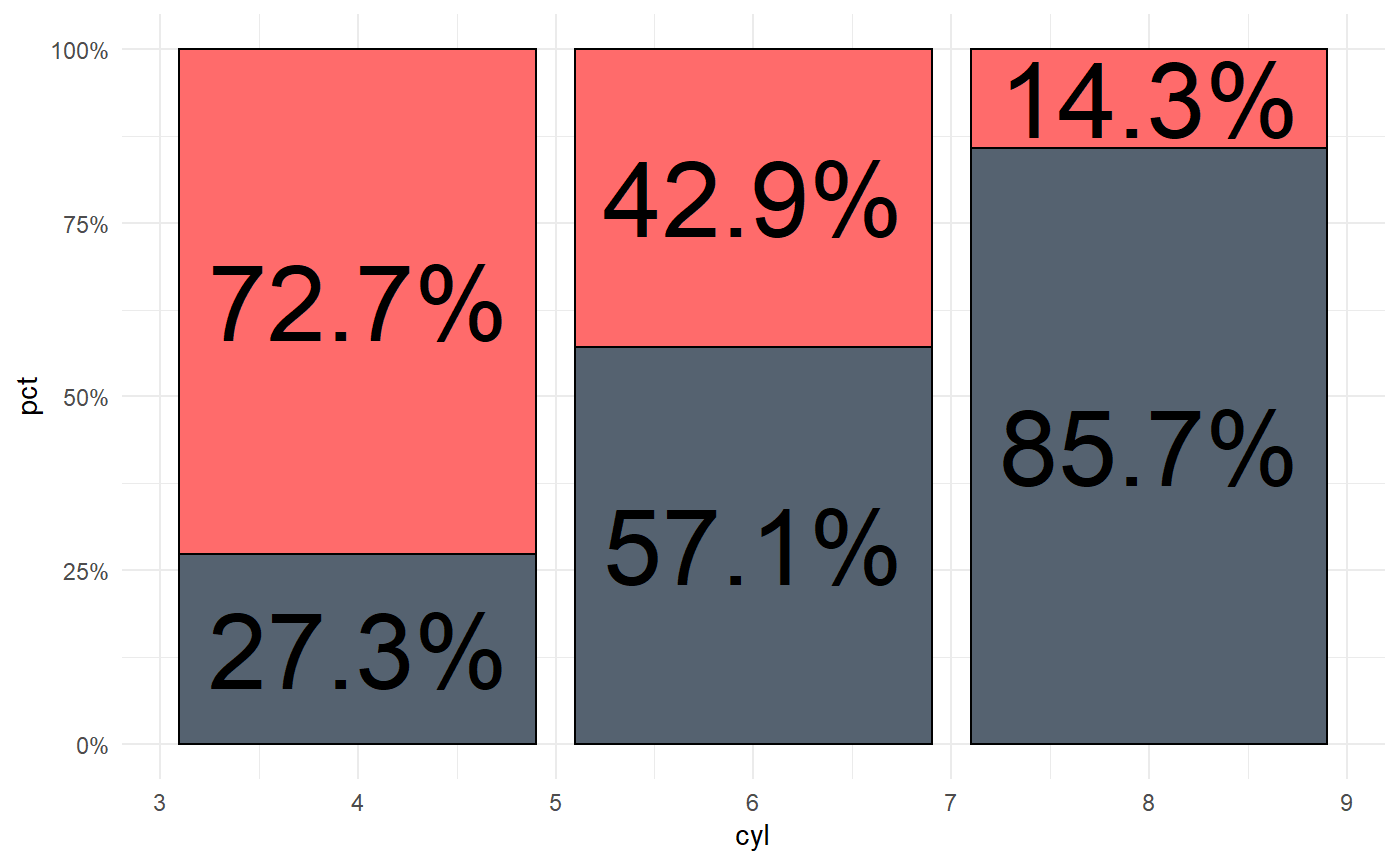
This function creates a crosstabulation heatmap
xbar(df, var1, var2, count = TRUE)
Arguments
| df | Name of the Dataset |
|---|---|
| var1 | This will be the variable that you do group_by with |
| var2 | This is the variable that will be counted |
| count | Will add the total count to each square if added |
Examples
mtcars %>% xbar(cyl, am)