
library(twitteR)
library(ROAuth)
library(tm)
library(stringr)
library(wordcloud)
library(syuzhet)
library(lubridate)
library(ggplot2)
library(scales)
library(reshape2)
library(dplyr)
FundEIU
I used to work at Eastern Illinois University. Because of enrollment declines and state budget cuts, my position was eliminated. There was an effort on campus this past academic year to try and raise awareness to get Springfield to give EIU the appropriate funds to maintain programs and enrollment. I wanted to see how that actually spread through social media, specifically Twitter.
## [1] "Using direct authentication"
## Use a local file to cache OAuth access credentials between R sessions?
## 1: Yes
## 2: No
I didn’t include the actual code because it has my token code.
This gives me access to the Twitter API, which allows me to scrape the hashtag from twitter. There are a lot of limits on the free, public API. One of the biggest is that it will only search backwards for a little over a week.
tweets <- searchTwitter("#FundEIU", n=5000)
tweets <- twListToDF(tweets)
Let’s just look at how tweets happen over the course of the last week.
minutes <- 240
ggplot(data=tweets, aes(x=created)) +
  geom_histogram(aes(fill=..count..), binwidth=160*minutes) +
  scale_x_datetime("Date") +
  scale_y_continuous("Frequency") + ggtitle("Usage of the #FundEIU Hashtag")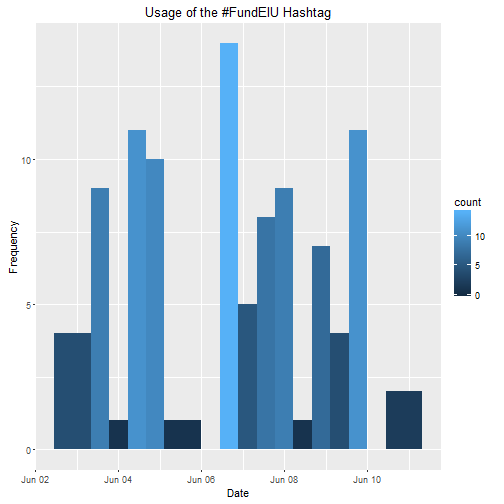
The frequency has dropped a lot. The plot below is when the movement was just taking off. There was a huge rally on February 6th and it’s easy to see the spike in usage then.
Let’s take a look at who is tweeting the most about the movement.
count <- count(tweets, screenName)
count  %>% arrange(count, desc(n))
## Source: local data frame [2 x 2]
##
## screenName n
## (chr) (int)
## 1 AFTunion 1
## 2 amandaramz14 1count <- filter(count, n >1)
ggplot(count, aes(x=reorder(screenName, n), y = n)) + geom_bar(stat="identity") + coord_flip()
Compare that to early February.
Lots of different names showing up.
I also wanted to do a little wordcloud to visualize what people are saying in the tweets.
nohandles <- str_replace_all(tweets$text, "@\\w+", "")
wordCorpus <- Corpus(VectorSource(nohandles))
wordCorpus <- tm_map(wordCorpus, removePunctuation)
wordCorpus <- tm_map(wordCorpus, content_transformer(tolower))
wordCorpus <- tm_map(wordCorpus, removeWords, stopwords("english"))
wordCorpus <- tm_map(wordCorpus, stripWhitespace)
library(RColorBrewer)
pal <- brewer.pal(9,"YlGnBu")
pal <- pal[-(1:4)]


wordcloud(words = wordCorpus, scale=c(5,0.1), max.words=100, random.order=FALSE,
rot.per=0.35, use.r.layout=FALSE, colors=pal)
Larger words are ones that show up more frequently.
I also wanted to conduct something called sentiment analysis. What this does is score each tweet on a series of sentiments such as positive, negative, surprise, trust, etc.
mySentiment <- get_nrc_sentiment(tweets$text)
tweets <- cbind(tweets, mySentiment)
sentimentTotals <- data.frame(colSums(tweets[,c(17:26)]))
names(sentimentTotals) <- "count"
sentimentTotals <- cbind("sentiment" = rownames(sentimentTotals), sentimentTotals)
rownames(sentimentTotals) <- NULL
ggplot(data = sentimentTotals, aes(x = sentiment, y = count)) +
geom_bar(aes(fill = sentiment), stat = "identity") +
theme(legend.position = "none") +
xlab("Sentiment") + ylab("Total Count") + ggtitle("Total Sentiment Score for All Tweets")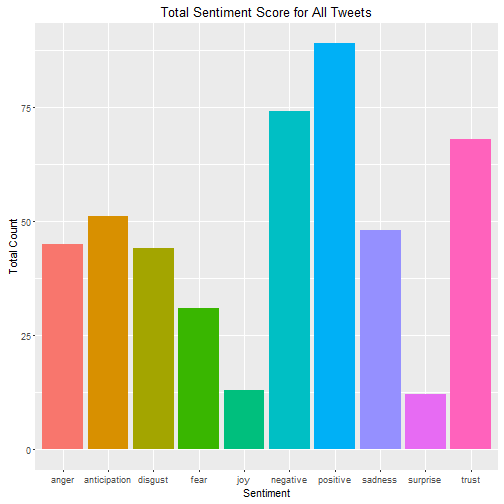
Despite the fact that EIU has only received 30% of their projected revenue for FY2016, the tweets are overall pretty positive. However there are a lot of angry tweets, understandably.
I got the idea and a good bit of the syntax from an excellent post by Julia Sigle on her blog.