
df <- read.csv("D:/Academic/kaggle.csv", stringsAsFactors = FALSE)
library(reshape2)
library(ggplot2)
library(car)
library(dplyr)
library(tidyr)
Academic Tools
I’ve always been interested in what sort of tools that academics use to get their job done. There are a plethora of ways to analyze data, to acquire research papers, etc.
So, Kaggle posted a nice dataset that I wanted to play around with.
This data is really tough to work with. For each of the tool variables it has two options for example, the SPSS variable.
head(df$SPSS)## [1] "SPSS" "" "SPSS" "SPSS" "" "SPSS"If the respondent uses it the dataframe has a value of “SPSS”, if not there is a missing value. That can’t be used to make bar charts because each positive value will be different. I have got to make some conversion.
CAR Package
The way that I am most comfortable with comes from Stata, and that’s just a bunch of recodes. That’s really labor intensive.
df$git<-recode(df$GITHUB,"'GitHub'='Yes'; ''='No'")
df$R<-recode(df$RTOOL,"'R'='Yes';''='No'")
df$SPSS<-recode(df$SPSS,"'SPSS'='Yes';''='No'")
df$mend <- recode(df$MENDREF,"'Mendeley'='Yes';''='No'")
df$latex <- recode(df$LATEX,"'LaTeX'='Yes';''='No'")
df$gdrive <- recode(df$GTDRIVE,"'Google Drive/Docs'='Yes';''='No'")
df$word <- recode(df$WORD,"'MS Word'='Yes';''='No'")
df$excel <- recode(df$EXCEL,"'MS Excel'='Yes';''='No'")
df$scholar <- recode(df$GSCHOLALERT,"'Google Scholar'='Yes';''='No'")
df$schol <- recode(df$GSCHOLSEARCH,"'Google Scholar'='Yes';''='No'")
m1 <- melt(df, measure.vars=c("git","R","SPSS", "mend", "latex", "gdrive", "word", "excel", "scholar" , "schol"))
qplot(value, data=m1, fill=value) + facet_wrap( facets= ~variable, scale="free_x")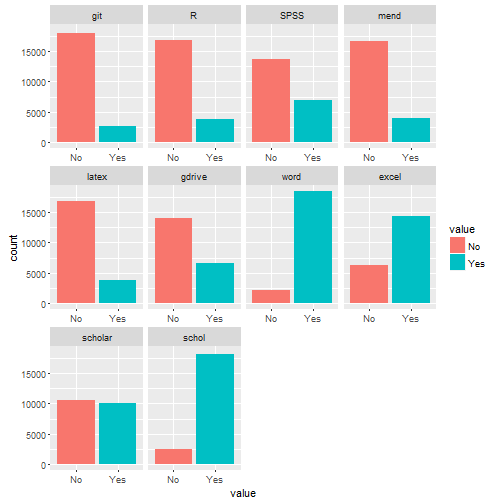
That get’s me where I want to go, but that takes a lot of syntax.
Apply
The beauty of R is that there are many ways to get where you want to go. I asked this question on my Kaggle Script and got two other approaches. One was apply.
cols_to_change = c('RTOOL', 'SPSS', 'GITHUB', 'MENDREF' , 'LATEX', 'WORD', 'EXCEL' , 'GSCHOLALERT', 'GSCHOLSEARCH', 'ACROBAT', 'RGATEALERT' , 'MAILAUTH' , 'RES4LIFE', 'SCOPSEARCH')
df[cols_to_change] <- sapply(df[cols_to_change], function(x) ifelse(nchar(x) > 0, 'Yes', 'No'))
##DPLYR
Hadley’s terrific dplyr package can also do the same thing in a little different way.
replace_blank_cells <- function(x){ifelse(nchar(x) > 0, "Yes", "No")}
tools <- c('RTOOL', 'SPSS', 'GITHUB', 'MENDREF' , 'LATEX', 'WORD', 'EXCEL' , 'GSCHOLALERT', 'GSCHOLSEARCH', 'ACROBAT', 'RGATEALERT' , 'MAILAUTH' , 'RES4LIFE', 'SCOPSEARCH')
df %>%
  select(one_of(tools)) %>%
  mutate_each(funs(replace_blank_cells)) %>%
  gather(variable, value) %>%
ggplot(aes(value, fill = value)) +
  geom_bar() +
  facet_wrap(~variable, scale = "free_x")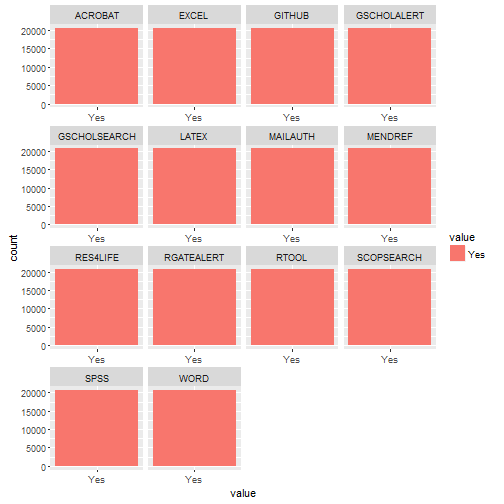
Overall, I wanted to put these syntax examples up so that I have a record of how to do each of them for future analysis.